Summary: What is an Inverted Yield Curve?
Finance and economics are both fields that make use of complex mathematics, historical precedent, and analysis of human psychology . At the end of the day, these are all just tools to aid in the process of prediction. The future state of the world is complex, but we as a species have made concerted efforts to predict it. One oft-quoted prediction that is relevant at the moment: an inverted yield curve foretells a coming recession. The yield curve is inverted now and has been for some time. Will we once again bear witness to the predictive capacity of the yield curve?
What is the Yield Curve?
The yield curve would more accurately be described as the yield line (or, to be faithful to the concepts of geometry, the yield line segment). It could theoretically be produced by anyone with a 6th grade education: it is a line that connects the yields on bonds of equal credit quality (most frequently applied to government-issued treasuries) of various maturity levels.
This definition opens itself to the need for numerous accompanying definitions. Treasuries are bonds that are issued by governments. In the case of Canada, the term length on treasuries can be as short as a month or as long as 30 years. Treasuries are issued in order to fund government operations, and purchasers generally receive ongoing interest payments (called coupons) as well as the face value of the bond upon maturity. Treasury yield, or yield to maturity, is a bit more complex of a topic. A bond’s yield to maturity is a calculation of the percentage return an investor can expect to earn on a bond purchase if the bond is held to maturity, expressed as an annual percentage rate. It is a function of both the bond’s current price and the coupon rate. I won’t get into the mechanism of calculating yield to maturity, but for the purposes of this topic it’s just important to know that yield to maturity goes down as bond price goes up and vice versa. It is yield to maturity of bonds that is plotted by the yield curve, not coupon rates.
Why Does the Yield Curve Invert?
The slope of the yield curve is so frequently cited because it is used to make predictions on the future state of economic activity. A yield curve is considered to be normal when it is upward sloping, meaning that yields are going up as the time until maturity of the bond increases:
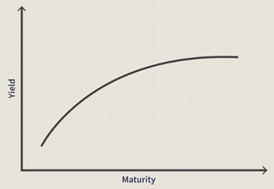
This relationship makes intuitive sense. When you buy a bond with the intent of holding it until maturity, you are tying up your capital which could be used for other purposes. The longer the term of the bond, the greater the lock-up period on your money. Longer-term bonds also carry more risk because they will be held further into the future and therefore exposed to more uncertain economic conditions. In exchange for greater risk and lower liquidity, investors generally expect higher yields for longer-term bonds.
On rare occasions, such as the one currently being experienced in Canada, the United States, and much of the rest of the world, the treasury yield curve can invert, with short-term bonds having higher yields than long-term bonds. The yield curve can invert at different points along the line, but the inversion most commonly cited by economists is the 10-2 year treasury yield spread, calculated by subtracting the 2-year treasury yield from the 10-year yield. When the resulting number is negative, this part of the yield curve is inverted. As of June 12, the Canadian treasury yield curve looks like this:
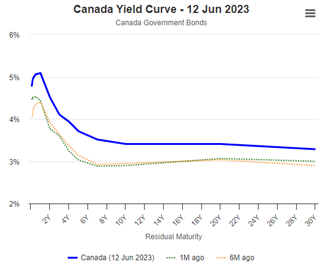
The normal yield curve has effectively been flipped upside down. Investors in the current environment are being paid less to take on greater risk with lower liquidity.
How can this be?
An inverted yield curve has been a strong indicator in the past that economic conditions will degrade, because it’s predictive of what central banks will be doing with interest rates in the future. Developed economies, in their efforts to fight inflation, have raised interest rates substantially over the past 15 months.
When the yield curve inverts, the expectation is that interest rates are going to be cut at some point in the future. While bondholders can get better annualized rates by opting for short-term bonds, the expectation is that they will not be able to rollover the proceeds of their bonds into a similarly high-yielding investment upon maturity. Wanting to take advantage of the elevated rate environment for a greater period of time, investors purchase long-term bonds, increasing their price and decreasing their yield (since bond price moves inversely to bond yield).
There are a few dynamics at play, but investors who purchase long-term bonds when the yield curve is inverted are by and large making a bet on the yield they can earn on long-term bonds currently versus the yield they will be able to earn in the future.
This relationship is also apparent when borrowing money, rather than loaning it to the government in the form of treasuries. Depending on the interest rate environment, a homebuyer may be able to get a better rate on a 3-year mortgage than a 5-year mortgage. However, if the purchaser believes that interest rates are likely to increase in the near future, they may opt for the higher rate at a longer term so that they don’t have to worry about renewing their mortgage in 3 years at a rate that may be substantially higher. The opposite is happening with an inverted yield curve, where investors accept a long-term yield lower than current short-term yields with the expectation that it will be higher than yields that will be available in the future.
Is a Recession Guaranteed?
As discussed, a driving factor of an inverted yield curve is the expectation that central banks will cut interest rates. There have been 10 recessions in the United States since 1955, and all were foreshadowed by an inverted yield curve.
Yield curve inversion is a comorbidity, rather than a cause, of recession. This is an important time to remember that the economy and the stock market are not the same thing.
The U.S. stock market largely saw past the looming debt ceiling.
For more articles on money, investing and personal finance by Max, click here.
Opinions are those of the author and may not reflect those of BMO Private Investment Counsel Inc., and are not intended to provide investment, tax, accounting or legal advice. The information and opinions contained herein have been compiled from sources believed reliable but no representation or warranty, express or implied, is made as to their accuracy or completeness and neither the author nor BMO Private Investment Counsel Inc. shall be liable for any errors, omissions or delays in content, or for any actions taken in reliance. BMO Private Investment Counsel Inc. is a wholly-owned subsidiary of Bank of Montreal.
